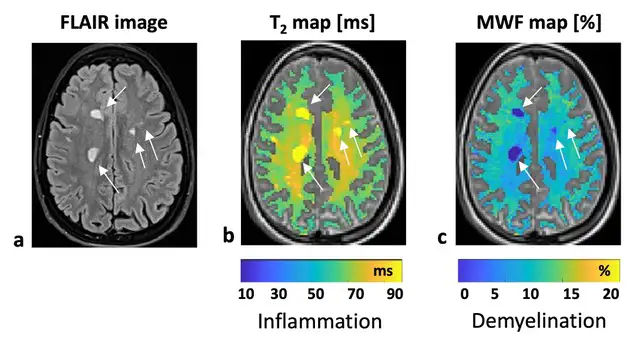
We are sharing the multicomponent T2 (mcT2) myelin-water fraction (MWF) mapping package. The mcT2 MWF mapping software turns standard multi-echo spin-echo (MESE) MRI scans into quantitative maps of myelin content in brain white matter.
Contrast in MESE MRI images is associated with white matter integrity and with multiple pathologies, including inflammation, demyelination, gliosis, and unregulated iron accumulation. MESE images, however, do not natively provide insights specific to myelin. The mcT2 MWF mapping software uses an advanced algorithm to analyze MESE MRI signal into “pools” that correspond to cellular compartments, such as the water trapped between layers of myelin. The analysis allows researchers to estimate the relative amount of myelin in each voxel via myelin-water fraction. By providing whole‑brain, quantitative maps of myelin from clinically accessible MRI data, this resource helps bridge the gap between basic myelin biology and in vivo human and animal studies.
Conventional myelin-water imaging is technically demanding and sensitive to scanner settings and software versions. These challenges make results difficult to compare across imaging sites and time points. The mcT2 MWF mapping framework addresses these limitations by combining a model known as the echo modulation curve (EMC) framework with data‑driven, multicomponent T2 analysis.
The analysis first learns a set of characteristic signal “motifs” from white matter, then uses them to explain the signal in each voxel. This global, dictionary‑based approach improves robustness to noise and to differences between scanners, leading to reliable and reproducible quantification of both myelin water fraction and geometric mean T2 (gmT2) values. To further stabilize the measurements, the implementation includes correction for transmit field (B1+) inhomogeneities and optional MP-PCA denoising.
The integration with MESE acquisitions and the incorporation of a validated EMC T2 mapping framework make the mcT2 MWF mapping software suitable for translational and multi‑site studies. Relevant applications include investigating white-matter changes in neurological diseases, monitoring demyelination and remyelination in preclinical models, and probing microstructural properties of normal brain development and aging.
The package is implemented in MATLAB with compiled C/C++ back‑end code and is intended for research use.
Related Publications
Data-driven algorithm for myelin water imaging: Probing subvoxel compartmentation based on identification of spatially global tissue features.
Magn Reson Med. 2022 May;87(5):2521-2535. doi: 10.1002/mrm.29125
Improved myelin water imaging using B 1+ correction and data-driven global feature extraction: Application on people with MS.
Imaging Neurosci (Camb). 2024 Jul 31;2:imag-2-00254. doi: 10.1162/imag_a_00254
Please cite these publications if you are using the quantitative mcT2 MWF mapping package in your research.
Get the Code
The software available on this page is provided free of charge and comes without any warranty. CAI²R and NYU Grossman School of Medicine do not take any liability for problems or damage of any kind resulting from the use of the files provided. Operation of the software is solely at the user’s own risk. The software developments provided are not medical products and must not be used for making diagnostic decisions.
The software is provided for non-commercial, academic use only. Usage or distribution of the software for commercial purpose is prohibited. All rights belong to the author (Noam Ben-Eliezer) and NYU Grossman School of Medicine. If you use the software for academic work, please give credit to the author in publications and cite the related publications. For information regarding commercial use of the package or the underlying algorithm, get in touch with Noam Ben-Eliezer.
Contact
Questions about this resource may be directed to Noam Ben-Eliezer, PhD at noambe@tauex.tau.ac.il.
Related Resources

Denoising multi-echo spin-echo MRI data with Marchenko-Pastur principal component analysis.

Software for quantification of T2 relaxation time and proton density from multi-echo spin-echo MRI data.