We are sharing MATLAB scripts for orientation distribution function (ODF) low-rank plus sparse (L+S) analysis of group diffusion data sets. The method avoids outlier bias while reliably detecting voxelwise group differences and correlations with demographic or behavioral variables. These analytic features facilitate detection of small group differences in clinical and research applications.
Recent advances in MRI acquisition make it possible to use high quality diffusion weighted protocols for routine in vivo study of white matter architecture but the resulting data are often challenging to analyze. Reducing the dimensionality of the data simplifies statistical analysis and helps detect large group differences but fails to fully capitalize on all acquired image volumes. Using all information, however, creates a risk that outliers may bias the analysis.
The method shared here and documented in the related publication operates on the ODF—either the diffusion ODF or fiber ODF—and applies a low-rank plus sparse (L+S) matrix decomposition to the voxelwise ODFs, separating the sparse individual variability in the sparse matrix S while recovering essential ODF features in the low-rank matrix L.
Analysis of the low-rank ODF distribution reduces the impact of inter-subject variability and avoids outlier bias by focusing on the essential ODF features of the population while maximizing the dimensionality of included diffusion information. The approach provides a foundation for improved detection of group differences in diffusion weighted imaging through primary component analysis. Identified group differences can be visualized with difference ODFs ΔODF and correlation ODFs RODF.
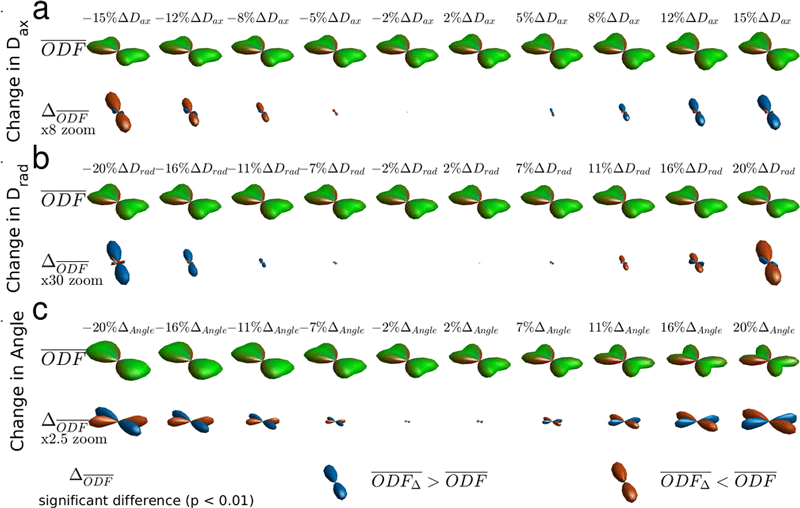
Drad (b) and crossing angle (c) of fibers relative to the reference group of ODFs. Blue ΔODF lobes indicate positive changes; red, negative.
Related Publication
Low Rank plus Sparse decomposition of ODFs for improved detection of group-level differences and variable correlations in white matter.
Neuroimage. 2018 Jul 1;174:138-152. doi: 10.1016/j.neuroimage.2018.03.014
Please cite this work if you are using ODF L+S analysis pipeline in your research.
Get the Code
The software available on this page is provided free of charge and comes without any warranty. CAI²R and NYU Grossman School of Medicine do not take any liability for problems or damage of any kind resulting from the use of the files provided. Operation of the software is solely at the user’s own risk. The software developments provided are not medical products and must not be used for making diagnostic decisions.
The software is provided for non-commercial, academic use only. Usage or distribution of the software for commercial purpose is prohibited. All rights belong to the author (Steven Baete) and NYU Grossman School of Medicine. If you use the software for academic work, please give credit to the author in publications and cite the related publications.
Contact
Questions about this resource may be directed to Steven H. Baete, PhD.